By Karen Collins, Head of Curriculum for Science at PiXL
The National Year of Reading is a timely reminder that in science, reading doesn’t always mean words on a page.
Science texts are highly multimodal. Meaning is communicated through diagrams, data tables and graphs as much as through written prose (National Literacy Trust, 2023). We wouldn’t expect students to decode challenging written texts without support, so why assume they can read a graph unaided?
When you display a graph in class, how long do you give students to read it? The concept of disciplinary literacy, in which each subject has its own reading conventions that must be explicitly taught, is central to the EEF’s Improving Literacy in Secondary Schools guidance (2018). In science, reading data is just as important as reading words.
According to Carpenter and Shah (1998), interpreting a typical line graph takes around 30 seconds, the same time needed to read and understand a paragraph of text. Most of that time is spent relating the line of best fit to contextual elements: the axes, the scale, the units. Understanding a graph is far more involved than simply spotting a pattern (Susac et al., 2018), and many students experience significant difficulties with exactly these tasks (Glazer, 2011). One of the most well-documented misconceptions is treating a graph as a literal picture of events rather than an abstract representation, sometimes called the ‘graph as picture’ error (Leinhardt et al., 1990). Asked to sketch a graph showing a ball rolling over a hill, many students draw a hill shape, regardless of what the data actually shows. It is a useful reminder that students are not simply being careless; they are making a logical but incorrect inference. Yet graph reading is rarely taught explicitly. We display a graph, ask a question, and move on. We assume the reading has happened. Often, it hasn’t.
Give students time to read before you ask them to interpret
Building in reading time before asking any questions is one of the simplest and most effective changes a science teacher can make. Think of it like giving students time to read a passage before discussing it. Students need uninterrupted time to make sense of what they’re looking at. A structured reading routine makes a real difference. Try asking students to work through these steps before any discussion begins:
- What does the title tell me about what is being investigated?
- What are the axes and what are the units?
- What does the scale look like?
- Are there any unusual features?
- What is the overall trend?
Only then should you move to asking them to explain or apply what they can see.
Explicitly model how you read a graph
It is worth remembering that what feels effortless to an expert is rarely effortless to a novice. As teachers, we read graphs fluently and automatically; students are still learning to do so. Expert readers of scientific data don’t just glance and understand. They work through graphs systematically, and students need to see this process modelled explicitly. Narrating your own thinking aloud as you read a graph together is one of the most powerful tools available: ‘First I’m looking at what’s on each axis… I can see the scale doesn’t start at zero, which means I need to think carefully about the size of any differences I can see.’
It is worth anticipating common stumbling blocks. Students frequently confuse slope with height, connect data points rather than draw a line of best fit, and ignore units or scale (Glazer, 2011). Those who can construct graphs competently in maths lessons often struggle to transfer those skills to science, where the data carries meaning that requires interpretation, not just description.
The link to reading comprehension is real
This is not just about graphs. Reading comprehension is one of the strongest longitudinal predictors of science attainment, particularly for students from disadvantaged backgrounds (Nunes et al., 2017). Science asks students to navigate a genuinely unfamiliar language: around 80% of scientific and technical English derives from Latin or Greek (National Literacy Trust, 2023), and many everyday words carry a more precise or entirely different meaning in a scientific context.
The strategies that support reading in science are the same ones that support reading across the curriculum: explicit teaching, modelling, structured routines, and time. Graphs are just another kind of text, and they deserve the same care.
If you would like to explore this further, Grappling with Graphs (Clegg & Collins, 2024) offers practical guidance on teaching graph construction and interpretation in secondary science.
Bring supported graph reading into independent study
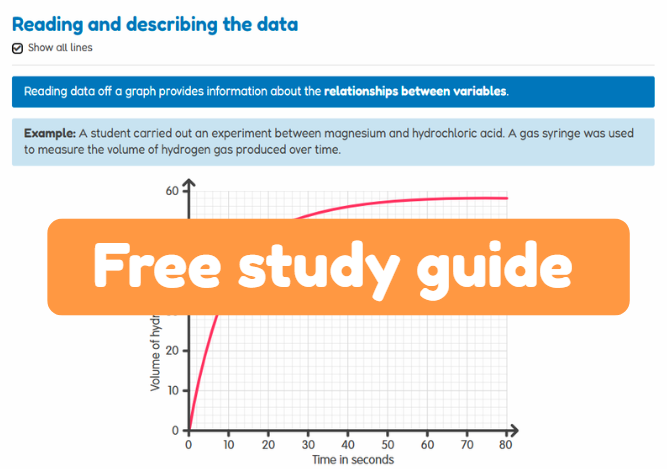
Our free reading graphs study guide helps students:
-
Understand key graph terminology
-
Read and describe data accurately
-
Interpret graphs and use data in explanations
It’s designed to build confidence step by step, making it easier for students to move from spotting patterns to explaining what the data shows.
Start a free 30-day trial to access the full range of Educake study guides and quizzes.
References
Carpenter, P. A. & Shah, P. (1998). A model of the perceptual and conceptual processes in graph comprehension. Journal of Experimental Psychology: Applied, 4(2), 75–100.
Clegg, A. & Collins, K. (2024). Grappling with Graphs: A Guide for Teachers of 11–16 Science. Association for Science Education/Millgate House.
EEF (2018). Improving Literacy in Secondary Schools. Education Endowment Foundation.
Glazer, N. (2011). Challenges with graph interpretation: A review of the literature. Studies in Science Education, 47(2), 183–210.
Leinhardt, G., Zaslavsky, O. & Stein, M. K. (1990). Functions, graphs, and graphing: Tasks, learning, and teaching. Review of Educational Research, 60(1), 1–64.
National Literacy Trust (2023). Science and Literacy.
Nunes, T. et al. (2017). The relative importance of two different mathematical abilities to mathematical achievement. British Journal of Educational Psychology.
Susac, A. et al. (2018). Student understanding of graph slope and area under a graph. Physical Review Physics Education Research, 14.